

Image Details
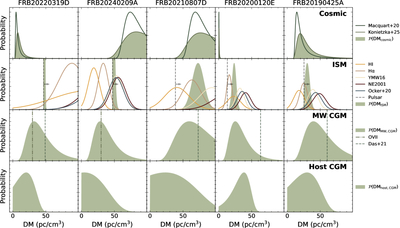
Caption: Figure 3.
The PDFs of the different DM components using various estimates, with the shaded curves showing the adopted PDFs used in our analysis. In each plot, all curves are arbitrarily scaled by the same factor for better visualization. The top row shows p(DMcosmic), which is estimated using the best fit of R. M. Konietzka et al. (2025), with the relation of J.-P. Macquart et al. (2020) plotted for reference. The middle row shows p(DMMW,ISM), where the final PDF is the combination of the H I, Hα, and YMW16 (J. M. Yao et al. 2017) estimates, truncated by the pulsar lower limit (vertical dashed line). For FRB 20220319D, the mean DMMW,ISM estimate is much larger than DMobs, so we set p(DMMW,ISM) as a delta function at the pulsar lower limit following (V. Ravi et al. 2025). We also show the NE2001 (J. M. Cordes & T. J. W. Lazio 2003; S. K. Ocker & J. M. Cordes 2024) and S. K. Ocker et al. (2020) models for comparison. The third row shows the YT20 estimate of DMMW,CGM. We also plot an estimate of DMMW,CGM using the nearest OV II absorption sight line to each FRB from T. Fang et al. (2015) and the scaling relation between NOV II and DM from (S. Yamasaki & T. Totani 2020), as well as the median of sight lines within 20∘ from S. Das et al. (2020) (but note that the uncertainty in both of these is quite large). In the bottom panel, we plot the final p(DMhost), which under our assumption of negligible DMhost,ISM becomes p(DMhost,CGM).
Other Images in This Article

Copyright and Terms & Conditions
© 2026. The Author(s). Published by the American Astronomical Society.

