

Image Details
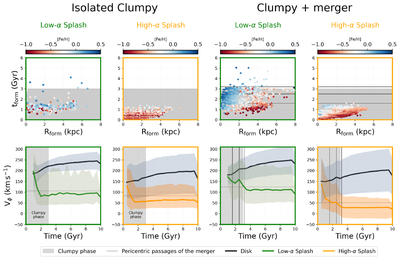
Caption: Figure 5.
The first two columns show the Isolated Clumpy model, while the last two columns show the Clumpy+Merger model. Top row: distribution of low- and high-α Splash stars in the tform–Rform plane, colored by [Fe/H], with tform being the star formation time and Rform the galactocentric radius at which each star formed. The horizontal lines in the two panels on the right indicate tform = 1.6, 2.5, and 3.2 Gyr, corresponding to the first, second, and final pericentric passages of the dwarf galaxy, respectively. Bottom row: evolution of mean Vϕ as a function of time for the low- (green) and high-α (orange) Splash populations. The Splash populations are represented by the colored lines, while the mean of Vϕ for the canonical low- and high-α disks are shown by the upper black line. The shaded area indicates the percentiles of each distribution. The vertical lines mark the same pericentric passages of the dwarf galaxy indicated in the top panels. The gray band in all panels indicates the period of the clumpy phase (first 3 Gyr).
Other Images in This Article
Copyright and Terms & Conditions
© 2026. The Author(s). Published by the American Astronomical Society.

