

Image Details
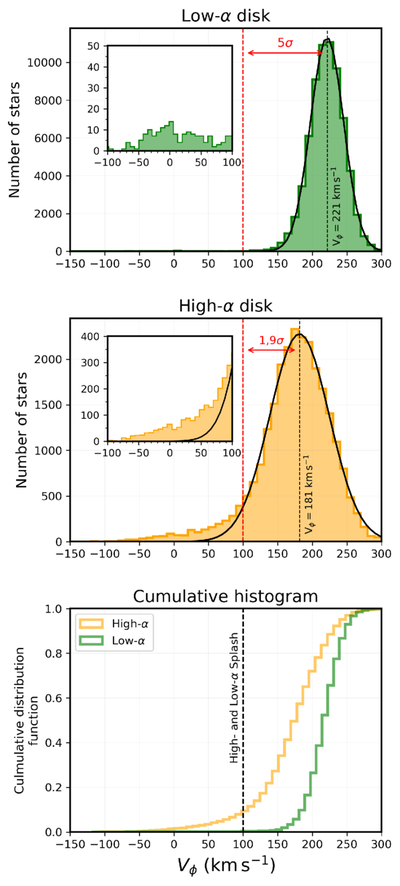
Caption: Figure 2.
Distribution of azimuthal velocity Vϕ for the low- and high-α samples in the upper and middle panels, respectively. The inner panels show a zoom on the left tail region of each distribution. The bottom panel shows the cumulative distribution of Vϕ for both samples. The dashed vertical line at Vϕ = 100 km s−1 indicates the cutoff used to select the Splash population. For the Gaussian fit, we found a mean of 〈Vϕ〉 = 221 km s−1 and a standard deviation of ﹩{\sigma }_{{V}_{\phi }}=24﹩ km s−1 for the low-α disk, while for the high-α sample, the values are 〈Vϕ〉 = 181 km s−1 and ﹩{\sigma }_{{V}_{\phi }}=43﹩ km s−1.
Other Images in This Article
Copyright and Terms & Conditions
© 2026. The Author(s). Published by the American Astronomical Society.

