

Image Details
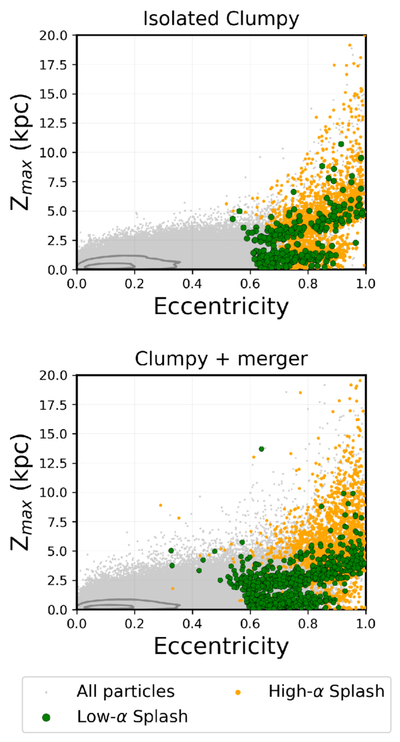
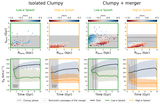
Caption: Figure 4.
Distribution of high- and low-α Splash populations on the Zmax versus eccentricity space for the Isolated Clumpy (top) and the Clumpy+merger (bottom panel) models. Gray points represent all particles in the simulation, and the gray contours indicate the higher-density region of the low-α/thin disk. The high-α Splash is shown in orange points, while the low-α Splash is shown in green points.
Other Images in This Article
Copyright and Terms & Conditions
© 2026. The Author(s). Published by the American Astronomical Society.

Copyright ©
2026 Astronomy Image Explorer. All Rights Reserved.
