

Image Details
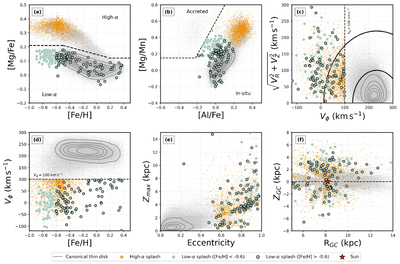
Caption: Figure 1.
Projection of the low-α Splash (green dots) and high-α Splash (orange points) in the (a) [Mg/Fe]–[Fe/H], where the dotted line indicates the separation between high- and low-α regions; (b) [Mg/Mn]–[Al/Fe], where the dashed line represent the limit between accreted and in situ regions; (c) Toomre diagram, ﹩\sqrt{{V}_{R}^{2}+{V}_{Z}^{2}}\,{\rm{versus}}\,{V}_{\phi }﹩. The vertical dashed line is Vϕ = 100 km s−1. The innermost curve represents ∥v − vcirc∥ = 130 km s−1 and the outermost curve is ∥v − vcirc∥ = 220 km s−1; (d) Vϕ–[Fe/H] space, where the horizontal dashed line is Vϕ = 100 km s−1; (e) Zmax–eccentricity and (f) ZGC–RGC, where the horizontal dashed line represents the Galactic plane (ZGC = 0 kpc), and the red star indicates the position of the Sun. In all panels, the gray points are the APOGEE sample, and the gray contours indicate the density of the low-α region. The difference between light green points and green points with a black border is only the range of metallicity of the stars.
Other Images in This Article
Copyright and Terms & Conditions
© 2026. The Author(s). Published by the American Astronomical Society.

