

Image Details
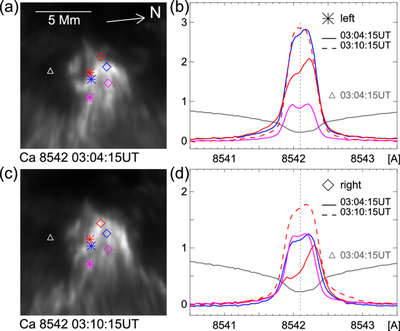
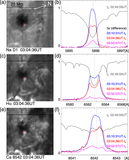
Caption: Figure 5.
(a) Ca 8542 line-center image of the flare kernel at 03:04:15 UT observed with SCIP. Colored symbols indicate the locations within the flare kernel from which the spectra shown in panel (b) were extracted. The asterisks ∗ are located along the left thread, while the diamonds ⋄ mark the right thread. The triangle △ indicates a nearby reference point in the umbra (outside the kernel). (b) Ca 8542 spectra obtained at the positions along the left thread indicated by the asterisk ∗ in panel (a). Solid and dashed curves represent spectra at 03:04:15 and 03:10:15 UT, respectively. (c) Same as panel (a), but for observations at 03:10:15 UT. (d) Same as panel (b), but for the right thread. In panels (b) and (d), all spectra are normalized to the local continuum level. The spectra at the reference point indicated by triangle △ in panels (a) and (c) are shown in gray. The other spectra are shown as difference spectra relative to the reference point. The time shown for each raster image or spectrum indicates the start time of the corresponding raster scan.
Other Images in This Article
Copyright and Terms & Conditions
© 2026. The Author(s). Published by the American Astronomical Society.

