

Image Details
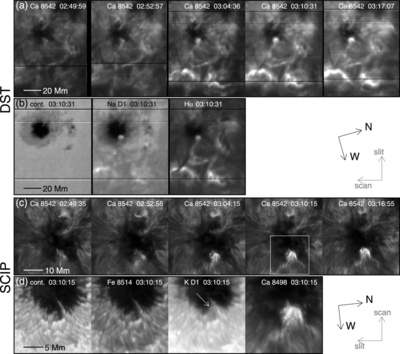
Caption: Figure 2.
(a) Time sequence images of the flare kernel observed with DST in the Ca 8542 line center. (b) DST images obtained at 03:10:31 UT in different spectral lines. From left to right, continuum, Na D1 line center, and Hα line center are shown. Solar north and west are indicated by the arrows labeled “N” and “W”. The field of view of the images is approximately 120″ × 150″. The scan and the slit directions are also shown by the gray arrows. The horizontal lines seen in the DST images are instrumental hair-line features along the scan direction. (c) Time sequence images observed with SCIP in the Ca 8542 line center. The field of view of the images is approximately 54″ × 54″. The white box indicates the field of view shown in panel (d). (d) SCIP images obtained at 03:10:15 UT in different spectral lines. From left to right, continuum, Fe 8514 line center, K D1 line center, and Ca 8498 line center are shown. Solar north and west are indicated by the arrows. The scan and the slit directions are shown by the gray arrows. The time shown in each image indicates the start time of the corresponding raster scan.
Other Images in This Article
Copyright and Terms & Conditions
© 2026. The Author(s). Published by the American Astronomical Society.

