

Image Details
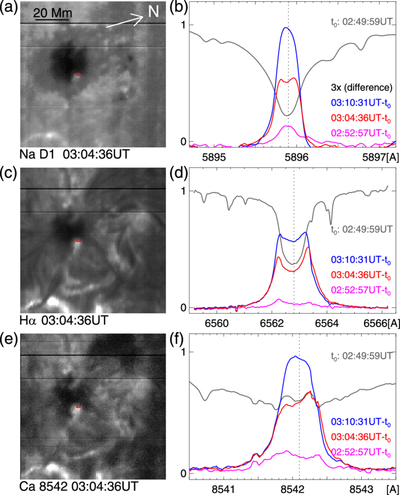
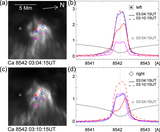
Caption: Figure 4.
(a) Line-center image of the Na D1 at 03:04:36 UT obtained with DST. The red box indicates the flare kernel region from which the spectra shown in panel (b) were averaged. (b) Temporal evolution of the Na D1 spectra averaged over the region indicated in panel (a). The spectrum at 02:49:59 UT is shown in gray and used as a reference (t0). Colored curves represent difference spectra relative to t0 at 02:52:57 UT (purple), 03:04:36 UT (red), and 03:10:31 UT (blue), respectively. (c) and (d) Same as panels (a) and (b), respectively, but for the Hα line. (e) and (f) Same as panels (a) and (b), respectively, but for the Ca 8542 line. The difference spectra are multiplied by a factor of 3 in panel (b) for clarity. All spectra in panels (b), (d), and (f) are normalized by the local continuum level and are smoothed using a 5-point running average. The time shown for each raster image or spectrum indicates the start time of the corresponding raster scan.
Other Images in This Article
Copyright and Terms & Conditions
© 2026. The Author(s). Published by the American Astronomical Society.

