

Image Details
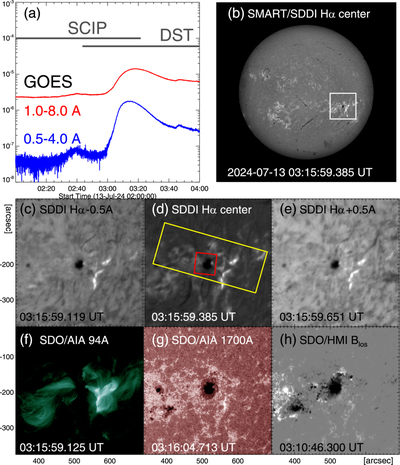
Caption: Figure 1.
(a) The GOES soft X-ray light curves in 1.0−8.0 Å and 0.5−4.0 Å from 02:00 to 04:00 UT on 2024 July 13 are shown as red and blue lines, respectively. The gray horizontal lines indicate the time intervals of the SCIP and DST observations. (b) The Hα line-center full-disk image taken by SMART/SDDI at 03:16 UT on 2024 July 13. Solar north and west are at the top and right. The white box indicates the target active region NOAA 13738 and corresponds to the field of view in Figures 1(c)–(h). (c), (d), and (e) The SMART/SDDI images in Hα−0.5 Å, center, and + 0.5 Å, respectively. The yellow and red boxes are the fields of view of DST and SCIP, respectively. (f) and (g) SDO/AIA images in 94 and 1700 Å. (h) Line-of-sight magnetogram taken at 03:10:46 UT on 2024 July 13 with SDO/HMI.
Other Images in This Article
Copyright and Terms & Conditions
© 2026. The Author(s). Published by the American Astronomical Society.

