

Image Details
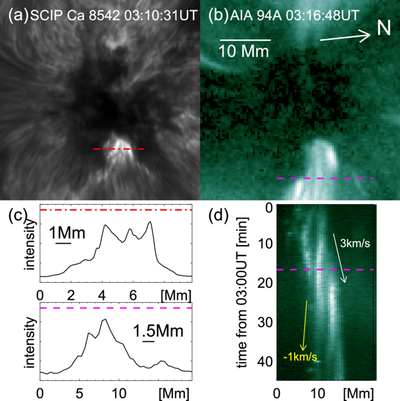
Caption: Figure 3.
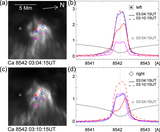
(a) SCIP Ca 8542 line-center image taken in the raster scan starting at 03:10:31 UT. The red dashed–dotted line indicates the position across the flare kernel where the intensity profile shown in panel (c) (top) was measured. (b) SDO/AIA 94 Å image taken at 03:16:48 UT. The purple dashed line indicates the position used to derive the intensity profiles shown in panel (c) (bottom) and the time slice image shown in panel (d). (c) Top: intensity profile across the flare kernel measured along the red line shown in panel (a). Bottom: intensity profile across the flare loop measured along the purple line shown in panel (b). The intensities are scaled arbitrarily. (d) Time slice image constructed along the purple dashed line in panel (b), showing the temporal evolution of fine structures in the flare loops.
Other Images in This Article
Copyright and Terms & Conditions
© 2026. The Author(s). Published by the American Astronomical Society.

