

Image Details
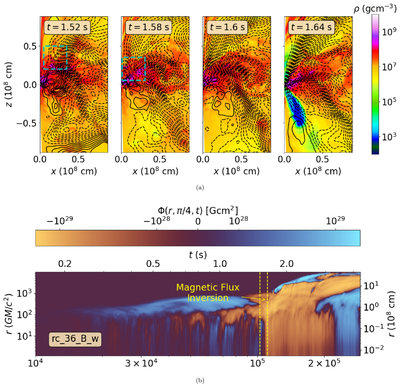
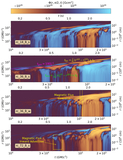
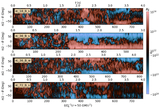
Caption: Figure 10.
(a) Density snapshot in the x–z plane at Φ = 0∘, with contours of the magnetic-flux function (Equation (10), used here as a proxy for the averaged magnetic-field lines) overlaid. We show model rc_36_B_w at the instant when magnetic-flux inversion occurs (see Figure 5). Solid and dashed lines denote magnetic-field loops of opposite polarity. Magnetic loops of polarity opposite to that threading the BH are highlighted at 1.52 and 1.58 s with a rectangle. (b) Spacetime diagram of the magnetic-flux function for model rc_36_B_w, evaluated at θ = 45∘. We highlight the time interval during which magnetic-flux inversion occurs, as shown in Figure 5.
Other Images in This Article
Copyright and Terms & Conditions
© 2026. The Author(s). Published by the American Astronomical Society.

