

Image Details
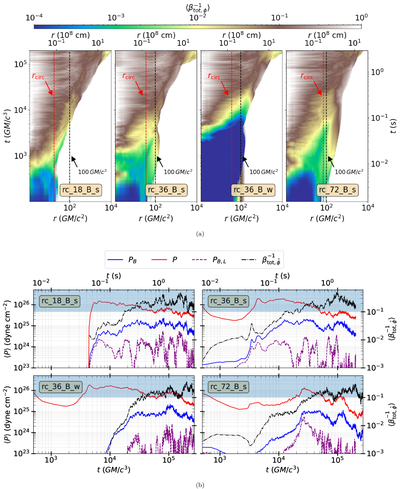
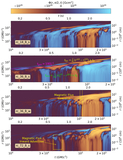
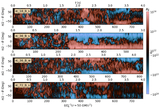
Caption: Figure 6.
(a) Spacetime diagram of the mass-weighted average of the inverse toroidal plasma beta (﹩\langle {\beta }_{\,{\rm{tot}}\,,\hat{\phi }}^{-1}\rangle =\langle {B}_{\hat{\phi }}^{2}\rangle /[2\langle P\rangle ]﹩). The vertical red (black) line delineates rcirc (r = 100GM/c2). (b) Average toroidal magnetic pressure (blue) ﹩\langle {P}_{B}\rangle =\langle {B}_{\hat{\phi }}^{2}\rangle /(8\pi )﹩, gas pressure (〈P〉, red), ﹩\langle {\beta }_{\,{\rm{tot}}\,,\hat{\phi }}^{-1}\rangle ﹩ (black dashed), and the large-scale averaged toroidal magnetic pressure (purple) ﹩\langle {P}_{B,L}\rangle ={\langle {B}_{\hat{\phi }}\rangle }^{2}/(8\pi )﹩, all measured at r = 100GM/c2 as a function of time. The shaded region represents ﹩\langle {\beta }_{\,{\rm{tot}}\,,\hat{\phi }}^{-1}\rangle \gt 0.1﹩. In both panels, the model name is shown in a text box.
Other Images in This Article
Copyright and Terms & Conditions
© 2026. The Author(s). Published by the American Astronomical Society.

