

Image Details
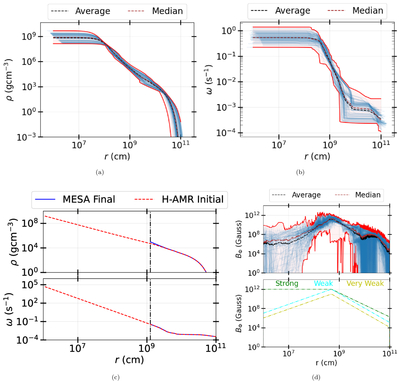
Caption: Figure 1.
Radial profiles of density, angular momentum, and magnetic fields across 120 MESA models from M. Renzo et al. (2026) In panel (a), we show the fluid density, and in panel (b), the angular velocity; the blue curves display the radial profiles of the different MESA models. The upper and lower red curves, which bracket the blue curves, represent the maximum and minimum values at each radius across all models, respectively. The black dashed line denotes the mean profile, and the brown dashed line shows the median. Panel (c) shows the mean density profile (upper panel) and angular-velocity profile (lower panel), with the inner 3 M⊙ of fluid removed (solid blue line) as it forms a BH. The red dashed curve shows the profile of the gas outside the enclosed BH mass coordinate as it freefalls toward the BH horizon. The vertical black dashed–dotted line marks the radial coordinate enclosing 3 M⊙ at the time of core collapse. Panel (d) exhibits the same information as in (a) and (b), but for the toroidal magnetic field. When averaging the toroidal magnetic field, we exclude all data points with field strengths below 1 G from the statistics. In the same plot, we append the initial magnetic-field profiles corresponding to the strong (green), weak (cyan), and very weak (yellow) cases. We separate the raw data from the analytic fit for clearer visualization.
Other Images in This Article
Copyright and Terms & Conditions
© 2026. The Author(s). Published by the American Astronomical Society.

