

Image Details
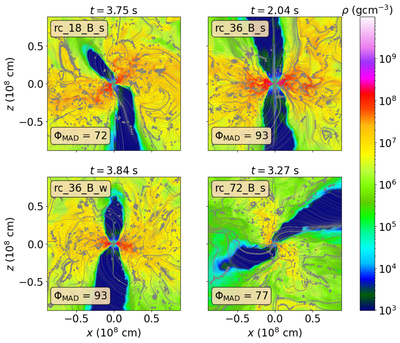
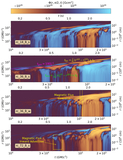
Caption: Figure 3.
Density maps (with magnetic-field lines overlaid) in the x–z plane for all models (except rc_36_B_vw) at the epoch when the instantaneous MAD parameter reaches its maximum.
Other Images in This Article
Copyright and Terms & Conditions
© 2026. The Author(s). Published by the American Astronomical Society.

Copyright ©
2026 Astronomy Image Explorer. All Rights Reserved.
