

Image Details
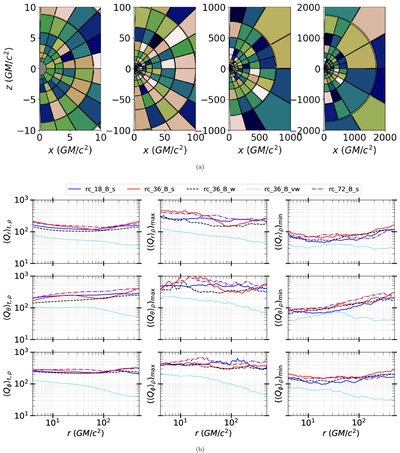
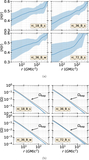
Caption: Figure 7.
(a) Mesh-block distributions for a range of plotting extents. The gray circle marks the event horizon. (b) MRI quality factors for all models within the SMR region 4 ≤ r/(GM/c2) ≤ 500. The first row shows the quality factor associated with the radial magnetic-field component: the left panel shows the time- and mass-averaged profiles, the middle panel shows the maximum values at each radius, and the right panel shows the minimum values at each radius. The second and third rows follow the same format but correspond to the θ and ϕ components of the magnetic field, respectively. All statistics use data with t > 1.5 s to ensure that the collapsar disk has formed self-consistently.
Other Images in This Article
Copyright and Terms & Conditions
© 2026. The Author(s). Published by the American Astronomical Society.

