

Image Details
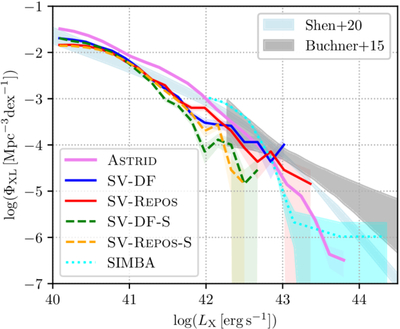
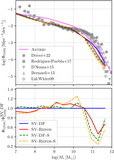
Caption: Figure 4.
AGN hard X-ray (2–10 keV) luminosity functions at z = 0. The line styles and colors are the same as in Figure 1. The SIMBA luminosity function (data from M. Habouzit et al. 2022) is also plotted for comparison. Shaded regions show observational constraints compiled by X. Shen et al. (2020) (light blue) and J. Buchner et al. (2015) (z = 0.1, gray).
Other Images in This Article
Copyright and Terms & Conditions
© 2026. The Author(s). Published by the American Astronomical Society.

Copyright ©
2026 Astronomy Image Explorer. All Rights Reserved.
