

Image Details
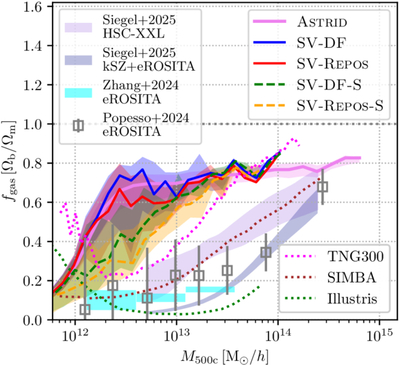
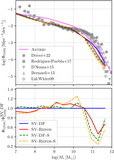
Caption: Figure E1.
Gas mass fraction as a function of halo mass (normalized by the cosmic baryon fraction). Upper and lower bounds of shaded regions indicate the 16th and 84th percentiles. Line styles follow those in Figure 1. Constraints from the analyses of J. Siegel et al( 2026), Y. Zhang et al. (2024), and P. Popesso et al. (2026) are also shown for reference. Several other simulations are also plotted for comparison: IllustrisTNG, SIMBA (R. Davé et al. 2019), and Illustris (we use curves shown in P. Popesso et al. 2026).
Other Images in This Article
Copyright and Terms & Conditions
© 2026. The Author(s). Published by the American Astronomical Society.

Copyright ©
2026 Astronomy Image Explorer. All Rights Reserved.
