

Image Details
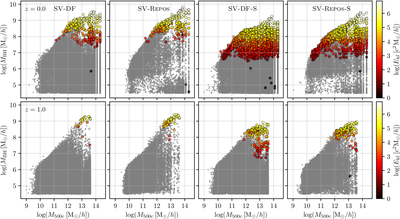
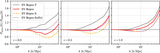
Caption: Figure A1.
Scatterplot of BH mass (MBH) versus halo mass (M500c), colored by the cumulative released kinetic feedback energy Ekf. The first and second rows show the relation at z = 0 and z = 1, respectively. The four columns correspond to the four different SV simulations. Color circles represent BHs that have released kinetic feedback energy, while gray points represent BHs that have not released kinetic feedback energy.
Other Images in This Article
Copyright and Terms & Conditions
© 2026. The Author(s). Published by the American Astronomical Society.

Copyright ©
2026 Astronomy Image Explorer. All Rights Reserved.
