

Image Details
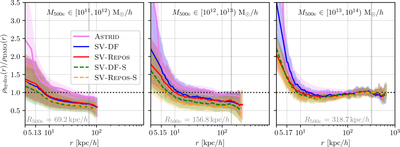
Caption: Figure 2.
Halo density profile ratios of halos in the hydrodynamical simulations to their matched DMO counterparts, at z = 0. The color and line styles are the same as in Figure 1. Unity is marked by a horizontal dotted line. Left, middle, and right panels show ratios for halos in the mass ranges of M500c = 1011–1012 M⊙ h−1, 1012–1013 M⊙ h−1, and 1013–1014 M⊙ h−1, respectively. Shaded areas represent the 16th to 84th percentile scatter among the matched halo population. Ratios at radii within a certain scale (﹩\sim 2{\epsilon }_{{\rm{g}}}^{{\rm{SV}}}﹩), rlin, are plotted on a linear scale to cover the halo centers, while ratios at larger radii are plotted with a logarithmic x-axis. rlin = 5.13, 5.15, and 5.17 kpc h−1 for the three mass bins, respectively. Median R500c value of the DMO halos (measured from SV-DMO) in each mass bin is shown by a vertical gray line in the corresponding panel.
Other Images in This Article
Copyright and Terms & Conditions
© 2026. The Author(s). Published by the American Astronomical Society.

