

Image Details
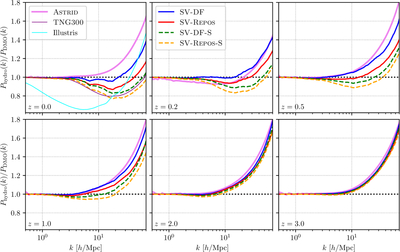
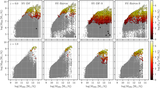
Caption: Figure 1.
Matter power spectra measured from the ASTRID simulation and the small simulations (listed in Table 1) normalized by their corresponding DMO counterparts, at z = 0, 0.2, 0.5, 1, 2, and 3 in six panels, respectively. For comparison, we also plot the P(k) suppression for the Illustris and TNG300 simulations at z = 0. Different simulations are color coded. Solid curves correspond to simulations with the fiducial feedback model, while dashed curves represent simulations with the stronger feedback model. The horizontal dotted line marks unity.
Other Images in This Article
Copyright and Terms & Conditions
© 2026. The Author(s). Published by the American Astronomical Society.

Copyright ©
2026 Astronomy Image Explorer. All Rights Reserved.
