

Image Details
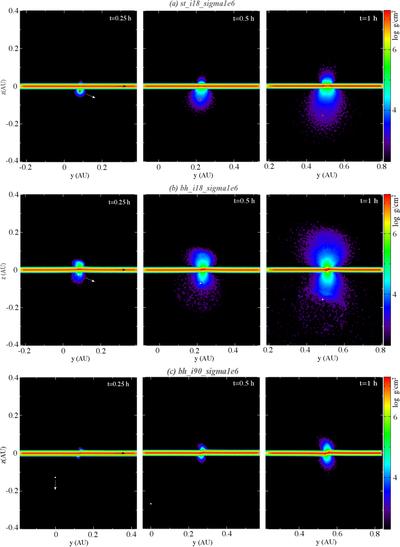
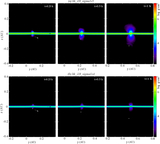
Caption: Figure 5.
Projected density plot for three simulations in Table 1, which involve stellar or black hole impacts on the disk at inclinations of π/10 and π/2. In the first column, arrows mark the directions of motion of both the disk gas and the impactor. For each simulation, the snapshots are shown at 0.25, 0.5, and 1.0 hr after the initial contact.
Other Images in This Article
Copyright and Terms & Conditions
© 2026. The Author(s). Published by the American Astronomical Society.

Copyright ©
2026 Astronomy Image Explorer. All Rights Reserved.
