

Image Details
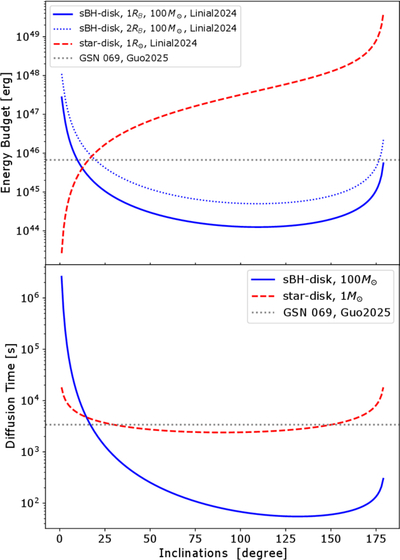
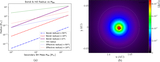
Caption: Figure 2.
Upper panel: energy budget estimated with Linial’s model for a surface density of 106 g cm−2. The blue solid and red dashed curves correspond to shocked regions of radius RB and 2RB. The gray dotted line indicates the minimum energy budget observed for GSN 069, ≃7 × 1045 erg (G. Miniutti et al. 2023; W. Guo & R.-F. Shen 2026). Lower panel: duration time as a function of inclination. The blue curve shows the prediction of the sBH-disk model, while the red dashed curve corresponds to the star-disk model.
Other Images in This Article
Copyright and Terms & Conditions
© 2026. The Author(s). Published by the American Astronomical Society.

Copyright ©
2026 Astronomy Image Explorer. All Rights Reserved.
