

Image Details
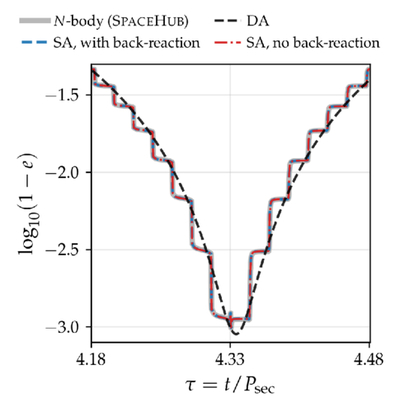
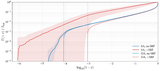
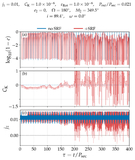
Caption: Figure 12.
The first eccentricity peak from Figure 2, integrated with multiple methods. The red-dashed and black-dashed lines reproduce the SA and DA results from Figure 2, respectively. The blue-dashed line shows the SA integration without the test-particle approximation (i.e., including the back-reaction onto the outer orbit), and the thick gray line shows the results of a direct N-body integration (SPACEHUB).
Other Images in This Article
Show More
Copyright and Terms & Conditions
© 2026. The Author(s). Published by the American Astronomical Society.

Copyright ©
2026 Astronomy Image Explorer. All Rights Reserved.
