

Image Details
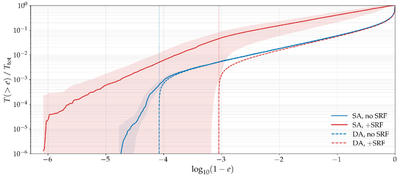
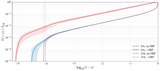
Caption: Figure 4.
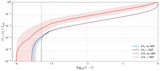
The cumulative residence time T( > e) as a fraction of the total integration time Ttot, versus ﹩{\mathrm{log}}_{10}(1-e)﹩, for the BBH–SMBH system of Figures 2–3, run 50 times with the random initial outer mean anomaly M2 ∈ [0, 2π). Red and blue colors correspond to SRFs (in this case GR precession) being switched on and off, respectively. The solid lines show the median SA results, and the shaded bands show their 5%–95% range. Dashed lines show the DA results; they asymptote toward zero when they reach their predicted maximum eccentricities ﹩{e}_{{\rm{\max }}}^{{\rm{DA}}}﹩ (vertical dotted lines).
Other Images in This Article
Show More
Copyright and Terms & Conditions
© 2026. The Author(s). Published by the American Astronomical Society.

