

Image Details
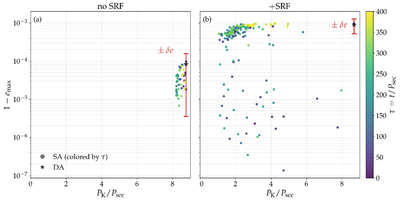
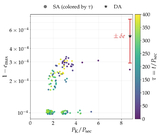
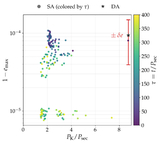
Caption: Figure 3.
A scatter plot of the maximum eccentricity ﹩1-{e}_{{\rm{\max }}}﹩ and secular period PK measured at the end of each secular cycle. Each point represents a single secular cycle, colored by the dimensionless time ﹩\tau =t/{P}_{{\rm{\sec }}}﹩ at which it occurs (color bar). The system under study is the same as in Figure 2. The red “error bars” in each panel mark the semianalytic prediction ﹩{e}_{{\rm{\max }}}^{{\rm{DA}}}\pm \delta e﹩ that is supposed to bracket the SA fluctuations in eccentricity; here, δe is obtained by inserting the jz-oscillation amplitude of L. Luo et al. (2016, their Equations (32)–(33)) for an eccentric outer orbit into the fluctuating-eccentricity prescription of E. Grishin et al. (2018b, their Equation (36)).
Other Images in This Article
Show More
Copyright and Terms & Conditions
© 2026. The Author(s). Published by the American Astronomical Society.

