

Image Details
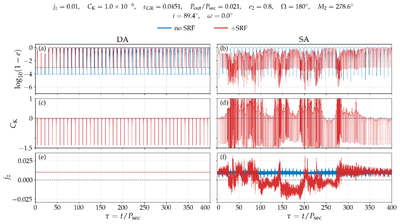
Caption: Figure 2.
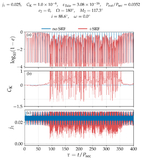
The time evolution of ﹩{\mathrm{log}}_{10}(1-e)﹩, CK, and jz for the BBH–SMBH triple of Section 3.1, for the initial outer mean anomaly ﹩{M}_{2}=278\mathop{.}\limits^{^\circ }6﹩. GR apsidal precession is the only SRF. The left (right) column shows DA (SA) results. Red (blue) curves show results from runs with GR precession switched on (off). The two dashed horizontal lines in panel (a) mark the DA-predicted eccentricity maximum ﹩1-{e}_{{\rm{\max }}}^{{\rm{DA}}}﹩. The dashed black lines in panels (e) and (f) mark jz = 0.
Other Images in This Article
Show More
Copyright and Terms & Conditions
© 2026. The Author(s). Published by the American Astronomical Society.

Copyright ©
2026 Astronomy Image Explorer. All Rights Reserved.
