

Image Details
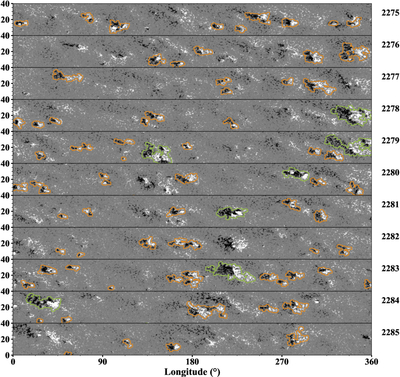
Caption: Figure 4.
Stack plot displaying ARs during CRs 2275–2285. Each tile is obtained from the synoptic maps for photospheric radial magnetic field of HMI, containing only latitudes from 0∘ to 40∘ in the northern hemisphere, stacked from the top to bottom in chronological order. White and black indicate positive and negative fields, respectively, and the colors saturate at 100 G. ARs from the database of R. Wang et al. (2023, 2024) are shown by contours. Orange contours mark ARs with unsigned flux less than 4 × 10²² Mx, while green contours mark ARs with unsigned flux greater than 4 × 10²² Mx.
Other Images in This Article
Copyright and Terms & Conditions
© 2026. The Author(s). Published by the American Astronomical Society.

Copyright ©
2026 Astronomy Image Explorer. All Rights Reserved.
