

Image Details
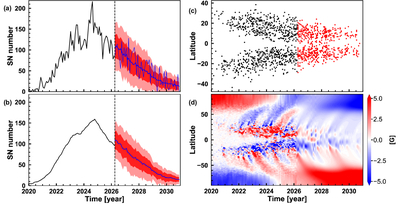
Caption: Figure 2.
Statistical properties of AR emergence prediction and one example of random realizations. Panel (a) shows the monthly AR number, with the black curve representing observations, the thick blue curve representing the average of all random realizations, the thin blue curve representing one random realization, and dark and light red shades representing 1 and 2 standard deviation ranges. Panel (b) is similar to (a), showing the 13 month smoothed version of the AR number, and the blue curve represents the average of all random realizations. Panel (c) shows the butterfly diagram of one random realization, with black representing observational ARs and red representing predicted ARs. Panel (d) shows the magnetic butterfly diagram as a result of the evolution of the ARs shown in panel (c).
Other Images in This Article
Copyright and Terms & Conditions
© 2026. The Author(s). Published by the American Astronomical Society.

