

Image Details
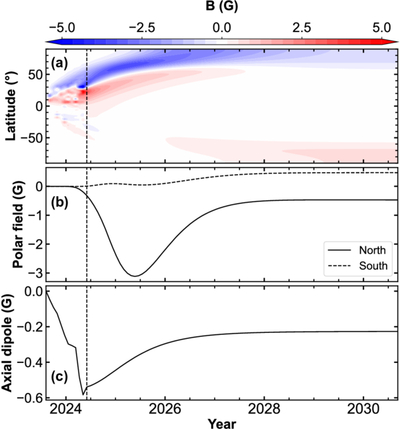
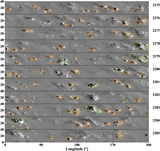
Caption: Figure 5.
SFT simulation of the ARs in the northern hemisphere during CRs 2275–2285. Panel (a) shows the magnetic butterfly diagram. Panel (b) shows the evolution of the polar field, with solid and dashed curves representing the southern and northern hemispheres, respectively. Panel (c) shows the evolution of the axial dipole moment. The vertical dashed lines indicate the time when the last AR is inserted into the simulation.
Other Images in This Article
Copyright and Terms & Conditions
© 2026. The Author(s). Published by the American Astronomical Society.

Copyright ©
2026 Astronomy Image Explorer. All Rights Reserved.
