

Image Details
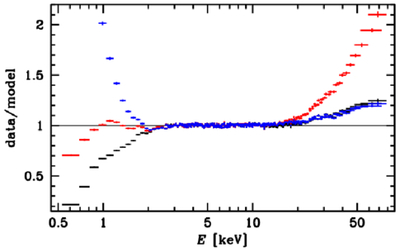
Caption: Figure 5.
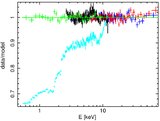
The data-to-model ratios for the models fitted to the Resolve data alone are shown for the broadband data. The red, blue, and black symbols correspond to the relxill, relxillCp, and reflkerrD models, respectively. The NICER and NuSTAR data are renormalized using the cross-calibration coefficients of our best broadband model (see the last column in Table 3). We see that all of the models fitted to 2.6–12 keV Resolve data diverge from the data beyond that range.
Other Images in This Article
Copyright and Terms & Conditions
© 2026. The Author(s). Published by the American Astronomical Society.

Copyright ©
2026 Astronomy Image Explorer. All Rights Reserved.
