

Image Details
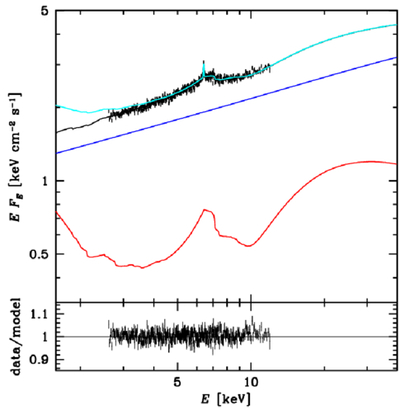
Caption: Figure 4.
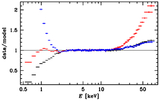
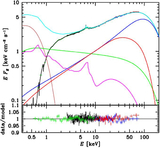
The Resolve unfolded spectrum (top) and data-to-model ratio (bottom) for the fit using relxillCp. The total and unabsorbed model spectra are shown by the solid black and cyan curves, respectively. The incident and reflection components are shown by the blue and red curves, respectively. Here and in Figures 6 and 7 below, the spectra have been rebinned for plotting.
Other Images in This Article
Copyright and Terms & Conditions
© 2026. The Author(s). Published by the American Astronomical Society.

Copyright ©
2026 Astronomy Image Explorer. All Rights Reserved.
