

Image Details
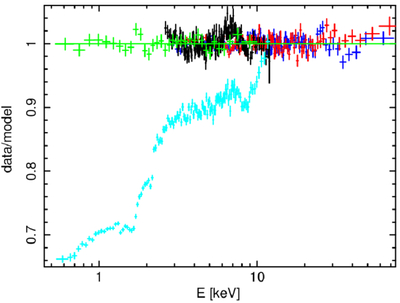
Caption: Figure 7.
The NICER (green), Resolve (black), and NuSTAR (blue and red) data-to-model ratios for the fit with the two-reflkerrD model, covering the full NuSTAR spectral range, 3–79 keV. We observe a substantial excess of Resolve counts in the Fe K range compared with NuSTAR and NICER. In cyan symbols, we also show the Xtend 0.5–10 keV spectrum unfolded with that model (not fitted).
Other Images in This Article
Copyright and Terms & Conditions
© 2026. The Author(s). Published by the American Astronomical Society.

Copyright ©
2026 Astronomy Image Explorer. All Rights Reserved.
