

Image Details
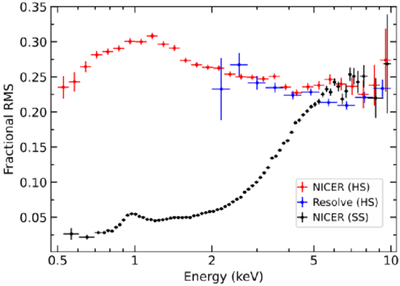
Caption: Figure 3.
The rms(E) in the 0.01–1 Hz frequency range for NICER (red) and XRISM Resolve (blue). For comparison, the black symbols show the rms(E) from NICER in the soft spectral state (A. A. Zdziarski et al. 2024). We see similar trends in soft X-rays, with broad peaks around 1 keV, although the soft-state rms is much lower. Above that, we observe a decrease with energy in the hard state and an increase in the soft state, while both converge in the Fe K energy region.
Other Images in This Article
Copyright and Terms & Conditions
© 2026. The Author(s). Published by the American Astronomical Society.

Copyright ©
2026 Astronomy Image Explorer. All Rights Reserved.
