

Image Details
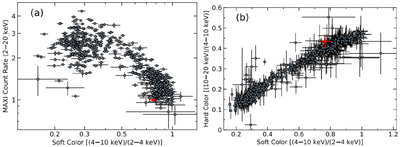
Caption: Figure 2.
(a) The 2–20 keV count rate versus the (4–10)/(2–4) keV hardness ratio. (b) The (10–20)/(4–10) keV hardness ratio versus the (4–10)/(2–4) keV hardness ratio (the color–color diagram). Both panels show MAXI data binned over 10 day intervals. The MAXI data averaged over the days of the XRISM observation we used are shown as red symbols.
Other Images in This Article
Copyright and Terms & Conditions
© 2026. The Author(s). Published by the American Astronomical Society.

Copyright ©
2026 Astronomy Image Explorer. All Rights Reserved.
