

Image Details
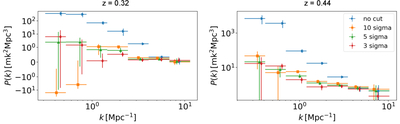
Caption: Figure 13.
The measured 1D power spectrum with no thresholding, 10σ, 5σ, and 3σ cut (the flags are applied at the autopower level for each delay-transformed visibility cube). The centers of the k-bins are misplaced for better visualization. The 5σ cut is used in our final results with UVDF, and the first two k-bins have very low signal-to-noise ratios.
Other Images in This Article
Show More
Copyright and Terms & Conditions
© 2026. The Author(s). Published by the American Astronomical Society.

Copyright ©
2026 Astronomy Image Explorer. All Rights Reserved.
