

Image Details
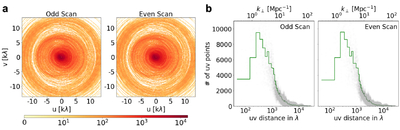
Caption: Figure 6.
The distribution of (u, v) points on a 2D plane at 1077.5 MHz. The cells on this plane are of size Δu = Δv = 60λ. (a) The number of u-v points on each cell is represented by the color. (b) The number count on each cell is plotted as gray points as a function of u-v distance on the lower x-axis, whereas the upper x-axis denotes the k⊥ values. The green solid line represents the average number of u-v points as a function of u-v distance (calculated on a bin size of Δu-v = 100).
Other Images in This Article
Show More
Copyright and Terms & Conditions
© 2026. The Author(s). Published by the American Astronomical Society.

Copyright ©
2026 Astronomy Image Explorer. All Rights Reserved.
