

Image Details
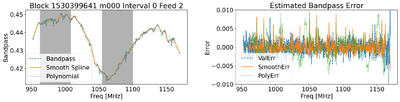
Caption: Figure 5.
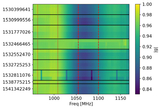
An illustration of the bandpass error estimation. The left panel shows the amplitude of the gain solution for the vertical linearly polarized feed of antenna m000 in the first solution interval of Block 1530399641. The z ∼ 0.32 and z ∼ 0.44 subbands are marked as the shaded regions. The right panel shows the results of the error estimation, where the y-axis shows the fractional error of the solution, calculated from the CASA solver (“ValErr”), from comparing against the smoothed solution (“SmoothErr”), and from comparing against a 10th-order polynomial fitting (“PolyErr”).
Other Images in This Article
Show More
Copyright and Terms & Conditions
© 2026. The Author(s). Published by the American Astronomical Society.

Copyright ©
2026 Astronomy Image Explorer. All Rights Reserved.
