

Image Details
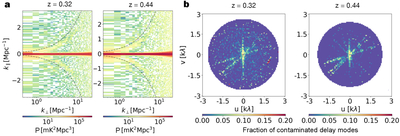
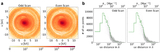
Caption: Figure 8.
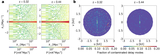
Indication of low-level broadband RFI. (a) The Stokes I 2D power spectrum derived from the analysis of 96 hr of MeerKAT interferometer data at z = 0.32 and z = 0.44, cross-correlating the even and odd-scan visibility cubes. Negative values are omitted. The dashed line marks the foreground avoidance boundary k∥ = 0.3 k⊥, corresponding to the expected horizon (wedge) extent plus an additional buffer; only modes above this line are used in the 1D power spectrum analysis. Stripes of excess power are visible near this boundary in both redshift bins. (b) After u-v gridding and performing FFT along frequency, the fraction of delay modes that exhibit power spectrum amplitude exceeding 5σ of the thermal noise is shown in color for both redshift bins. This fraction is significantly higher near the u = 0 line relative to other regions of the u-v plane. These affected modes contribute to the excess power observed in the 2D power spectrum.
Other Images in This Article
Show More
Copyright and Terms & Conditions
© 2026. The Author(s). Published by the American Astronomical Society.

