

Image Details
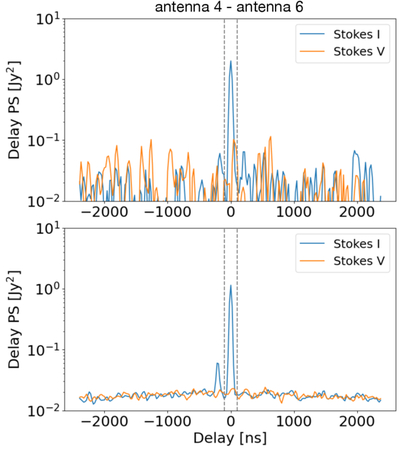
Caption: Figure 9.
Delay power spectra for an antenna pair affected by broadband RFI during one particular scan (z = 0.32 band). Top panel: for one 8 s time integration; bottom panel: averaged over all time samples within a 15-minute scan. The region bounded by the vertical dashed lines (±100 ns) denotes foreground-affected modes. The Stokes V power is added to give an estimate of the expected thermal noise. The contamination cannot be identified in the top panel, as noise dominates the higher delay modes. Upon averaging all time samples within a scan, the thermal noise drops substantially and the contamination can be identified in the bottom panel (small peak at negative delay on the left of the foreground-dominated region).
Other Images in This Article
Show More
Copyright and Terms & Conditions
© 2026. The Author(s). Published by the American Astronomical Society.

