Image Details
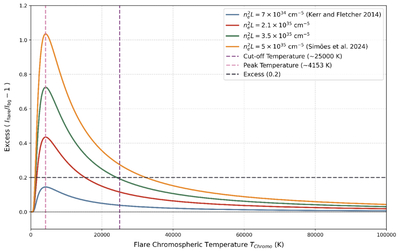
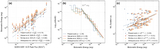
Caption: Figure 3.
Theoretical evolution of the flare-to-background intensity excess as a function of chromospheric temperature under varying column emission measures (﹩{n}_{\,\rm{e}\,}^{2}L﹩). The four solid curves illustrate the results for different ﹩{n}_{\,\rm{e}\,}^{2}L﹩, ranging from 7 × 1034 cm−5 to 5 × 1035 cm−5. The vertical pink dashed line indicates the peak excess, which consistently occurs at ∼4153 K. The vertical purple dashed line marks the physical cut-off temperature at ∼25,000 K. The horizontal gray dashed line represents a flare-to-background intensity excess of 0.2.
Other Images in This Article
Copyright and Terms & Conditions
© 2026. The Author(s). Published by the American Astronomical Society.
Copyright ©
2026 Astronomy Image Explorer. All Rights Reserved.