Image Details
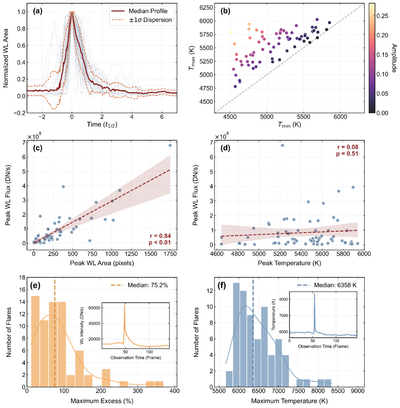
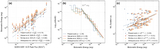
Caption: Figure 2.
Statistical analysis of the integrated WL flux, flare radiating area, and temperature across the 70 solar WLFs. (a) Flare area evolution template of 70 solar WLFs, scaled to relative time (t1/2, the full width at half-maximum) and amplitude. The median of all 70 solar WLFs (red solid line), as well as the robust standard deviation (orange dotted lines), are overlaid. (b) Scatterplot of maximum versus minimum temperatures, with colors indicating the maximum amplitude of temperature variations during flares. (c) and (d) Correlations between peak WL flux and peak flare area or peak temperature. The dark red dashed lines represent the linear regression fits to the data, while the corresponding shaded bands indicate the 95% confidence intervals of the fits. The Pearson correlation coefficient (r) and the statistical significance (p-value) for each relationship are annotated within the respective panels. (e) Distribution of the maximum intensity excess among all pixels for each WLF, with a median value of 75.2%. The inset displays the intensity evolution of the pixel with the largest maximum intensity excess across all flares. (f) Similar to (e), but for the maximum temperature with a median value of 6358 K.
Other Images in This Article
Copyright and Terms & Conditions
© 2026. The Author(s). Published by the American Astronomical Society.