Image Details
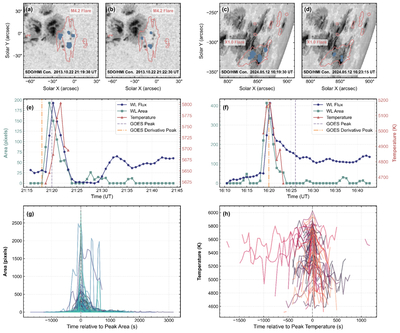
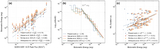
Caption: Figure 1.
Evolution of the integrated WL flux, flare radiating area, and temperature for solar WLFs. (a) and (b) Spatial distributions of WL emission enhancement signals (blue) at different times during an M4.2 solar WLF. The red contour encompasses the flare ribbon region in AIA 1600 Å observations. (c) and (d) Similar to (a) and (b), but for an X1.0 solar WLF. (e) and (f) The temporal evolution of the integrated WL flux, flare area, and temperature for the two representative WLFs. Purple and orange vertical dashed lines indicate the peak times of GOES SXR 1–8 Å flux and its derivative, respectively. (g) and (h) The temporal evolution of the flare area and temperature for the other 68 WLFs.
Other Images in This Article
Copyright and Terms & Conditions
© 2026. The Author(s). Published by the American Astronomical Society.