Image Details
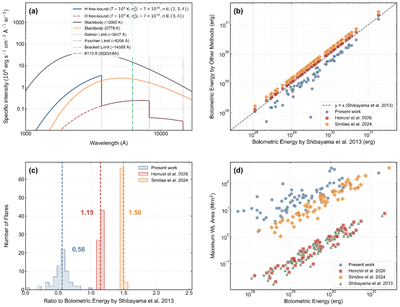
Caption: Figure 4.
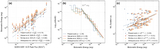
Comparison of energy estimates from different methods. (a) Specific intensity spectra for the blackbody model and Hfb continuum model. (b) and (c) Scatterplot and histogram comparing the bolometric energy derived from the present work and another two methods (P. J. A. Simões et al. 2024; P. Heinzel et al. 2026) with respect to the traditional blackbody model with fixed temperature (T. Shibayama et al. 2013). (d) Maximum flare area versus bolometric energy estimated from these methods.
Other Images in This Article
Copyright and Terms & Conditions
© 2026. The Author(s). Published by the American Astronomical Society.
Copyright ©
2026 Astronomy Image Explorer. All Rights Reserved.