Image Details
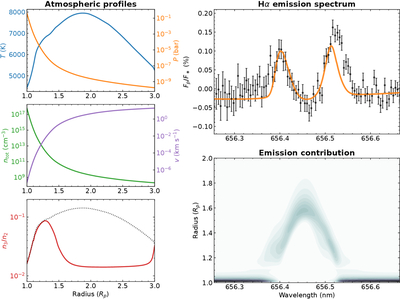
Caption: Figure 2.
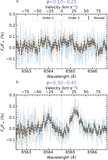
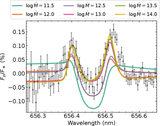
The left column shows the outflow temperature, pressure, velocity, and hydrogen number density profiles as a function of radius for ﹩\dot{M}=1{0}^{13}﹩ g s−1, together with the excited-state population ratio n3/n2. The dotted black line shows n3/n2 under the LTE assumption, highlighting the NLTE departure in the extended atmosphere. The right column shows the outflow model synthetic spectrum for ﹩\dot{M}=1{0}^{13}﹩ g s−1 (orange) compared with the observed line profile (black) and the emission contribution function as a function of wavelength and radius. The line core probes up to 1.8 Rp, while the double peaks probe ∼1.3 Rp.
Other Images in This Article
Copyright and Terms & Conditions
© 2026. The Author(s). Published by the American Astronomical Society.