Image Details
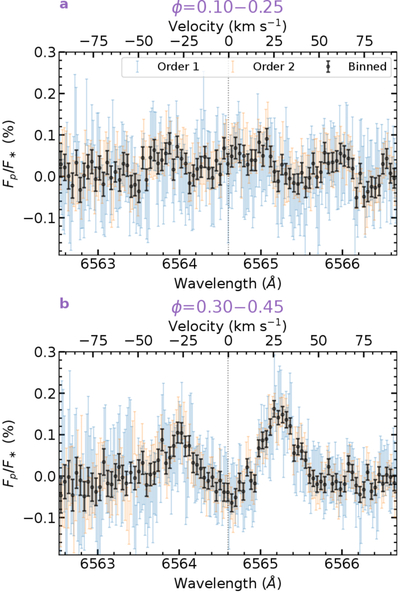
Caption: Figure A2.
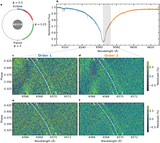
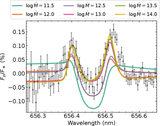
Phase-averaged Hα line profile in the planet’s rest frame. (a) ϕ = 0.05–0.25, where the dayside is largely hidden, and no significant signal is detected. (b) ϕ = 0.30–0.45, where the dayside dominates, and the double-peaked emission with central self-absorption is detected at 10σ. Blue and orange points show the two independent spectral orders; black points are binned fluxes in every five data points.
Other Images in This Article
Copyright and Terms & Conditions
© 2026. The Author(s). Published by the American Astronomical Society.
Copyright ©
2026 Astronomy Image Explorer. All Rights Reserved.