Image Details
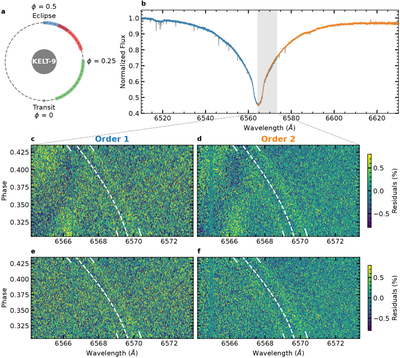
Caption: Figure A1.
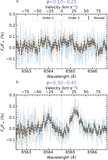
Phase coverage of KPF observations and time-series spectra of KELT-9 b. (a) Phase coverage of three epochs of KPF observations (shaded curves). The illustrations of object and orbit sizes are to scale. (b) One exposure of the KELT-9 spectrum around Hα as observed with KPF. Blue and orange show two different spectral orders with an overlapping wavelength region (gray shading). Gray lines in the background show the spectrum before telluric removal. (c) and (d) One epoch of 2D time-series residual spectra after removing the average stellar spectrum in each order. White dashed lines mark the expected center of the planetary Hα emission following the Keplerian orbital motion. The residual pattern at bluer wavelengths is caused by stellar pulsation contamination. (e) and (f) Same as panels (c) and (d), but removing the stellar contamination using Gaussian processes for visual clarity. During the data analysis, we masked the contaminated region with ∣v∣ < 110 km s−1 in the stellar rest frame.
Other Images in This Article
Copyright and Terms & Conditions
© 2026. The Author(s). Published by the American Astronomical Society.