

Image Details
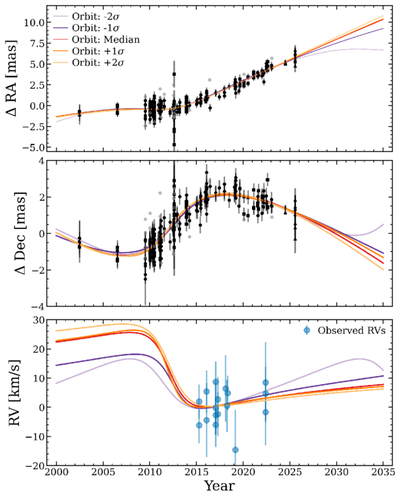
Caption: Figure 9.
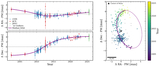
Future model constraints. Orbital fits corresponding to the median and the ±1 σ and ±2σ for the joint 2D probability distribution of avis and P as given in Table 5. The models are extended to 2035 to illustrate the utility of future measurements to further constrain the orbit. Top and middle panels: these show the relative position over time without removing the proper motion; data points are plotted using the same symbols as Figure 4. Bottom panel: predicted radial-velocity curves for the same five orbits. The modeled curves include a fitted offset to the observed velocities (Table 2).
Other Images in This Article
Copyright and Terms & Conditions
© 2026. The Author(s). Published by the American Astronomical Society.

Copyright ©
2026 Astronomy Image Explorer. All Rights Reserved.
