

Image Details
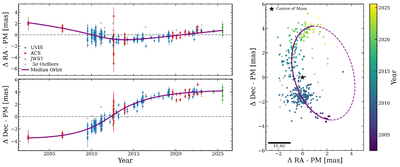
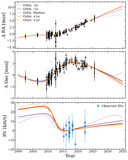
Caption: Figure 4.
Best-fit orbital model. Left: our median model (purple line) shown compared to the data after subtracting out the derived proper motion. The marker shape and color correspond to the instrument used for measurement, and the gray points represent 3σ outliers from the median fit. Right: our median orbital model plotted with the on-sky data in the proper-motion subtracted frame colored by observation date; the orbit is shown as a dashed line outside our observation window.
Other Images in This Article
Copyright and Terms & Conditions
© 2026. The Author(s). Published by the American Astronomical Society.

Copyright ©
2026 Astronomy Image Explorer. All Rights Reserved.
