

Image Details
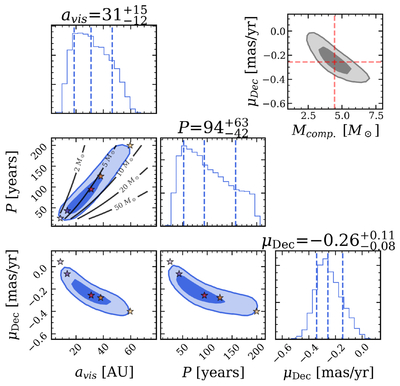
Caption: Figure 5.
Degeneracies corner plot. Corner plot showing the degeneracies between period (P), semimajor axis (avis), and the decl. proper motion. The cutout in the top right shows the degeneracy between the companion mass and the decl. proper motion (μDec). The contours on the avis vs. P subplot represent a constant mass corresponding to Mcomp, showing the spine of the ellipse closely follows along the 5 M⊙ contour. The stars in each panel represent the orbital solutions corresponding to the median, ±1σ and ±2σ of the joint 2D probability distribution of avis and P.
Other Images in This Article
Copyright and Terms & Conditions
© 2026. The Author(s). Published by the American Astronomical Society.

Copyright ©
2026 Astronomy Image Explorer. All Rights Reserved.
