

Image Details
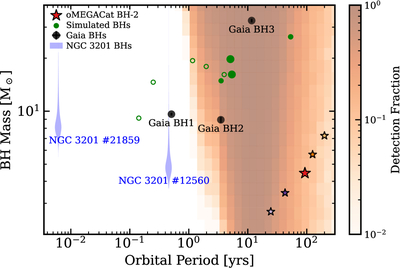
Caption: Figure 8.
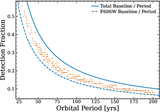
Black Hole Binary Summary. A comparison of dynamically detected black hole–star binaries and oMEGACat BH-2. For oMEGACat BH-2, in addition to the median fit (red star), we show the representative orbits from Table 5, using the same colors as Figure 5. For the other observed systems, spectroscopically detected binaries in the globular cluster NGC 3201 (B. Giesers et al. 2018, 2019) are shown as violin plots to represent the mass-inclination degeneracy, and the three Gaia BHs are also shown (K. El-Badry et al. 2023a, 2023b; Gaia Collaboration et al. 2024). The detection fraction shown in the background assumes a binary with the same secondary mass and observational cadence and uncertainties as for oMEGACat BH-2 and is described in Section 4.4. We also add simulated binaries (green circles; calculated in Section 5.3) from the ω Cen simulations in Section 2.3. The size of the marker corresponds to its detection fraction, and open circles indicate no detection; exact values are given in Table 6.
Other Images in This Article
Copyright and Terms & Conditions
© 2026. The Author(s). Published by the American Astronomical Society.

